Publications
You can also find my publications on Google Scholar.
2025
-
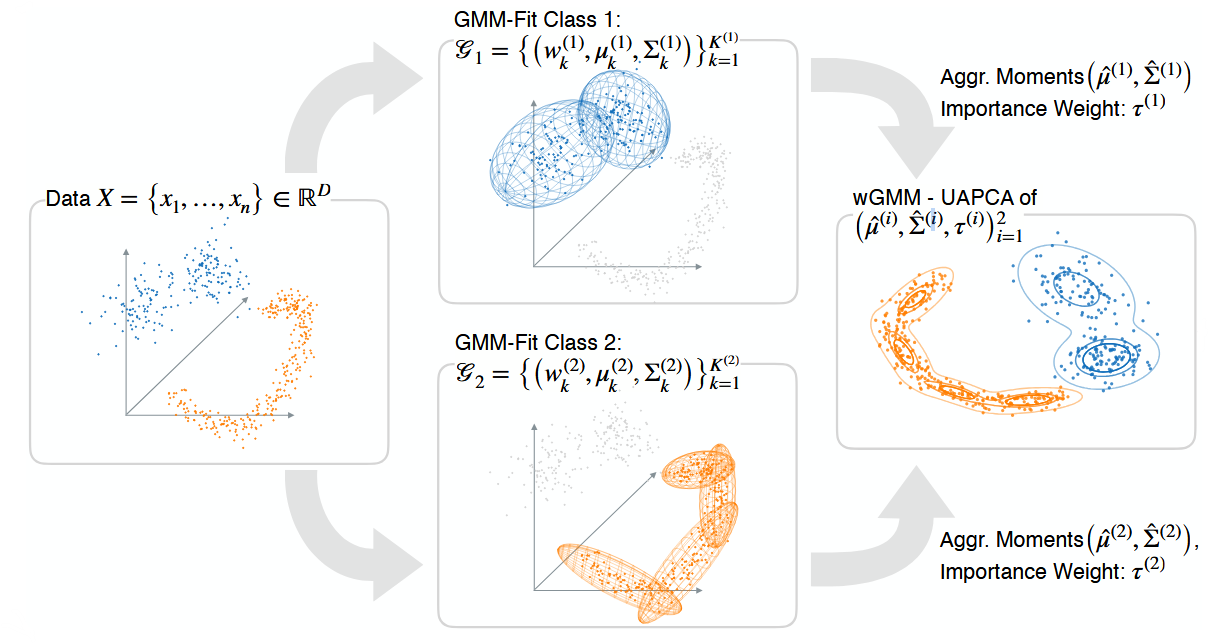 Uncertainty-Aware PCA for Arbitrarily Distributed Data Modeled by Gaussian Mixture ModelsDaniel Klötzl, Ozan Tastekin, David Hägele, and 2 more authorsIn 2025 IEEE Workshop on Uncertainty Visualization: Unraveling Relationships of Uncertainty, AI, and Decision-Making, 2025
Multidimensional data is often associated with uncertainties that are not well-described by normal distributions. In this work, we describe how such distributions can be projected to a low-dimensional space using uncertainty-aware principal component analysis (UAPCA). We propose to model multidimensional distributions using Gaussian mixture models (GMMs) and derive the projection from a general formulation that allows projecting arbitrary probability density functions. The low-dimensional projections of the densities exhibit more details about the distributions and represent them more faithfully compared to UAPCA mappings. Further, we support including user-defined weights between the different distributions, which allows for varying the importance of the multidimensional distributions. We evaluate our approach by comparing the distributions in low-dimensional space obtained by our method and UAPCA to thoseobtained by sample-based projections.
@inproceedings{klotzl2025uncertainty, title = {Uncertainty-Aware PCA for Arbitrarily Distributed Data Modeled by Gaussian Mixture Models}, author = {Kl{\"o}tzl, Daniel and Tastekin, Ozan and H{\"a}gele, David and Evers, Marina and Weiskopf, Daniel}, booktitle = {2025 IEEE Workshop on Uncertainty Visualization: Unraveling Relationships of Uncertainty, AI, and Decision-Making}, year = {2025}, volume = {}, number = {}, pages = {}, organization = {IEEE}, doi = {}, } -
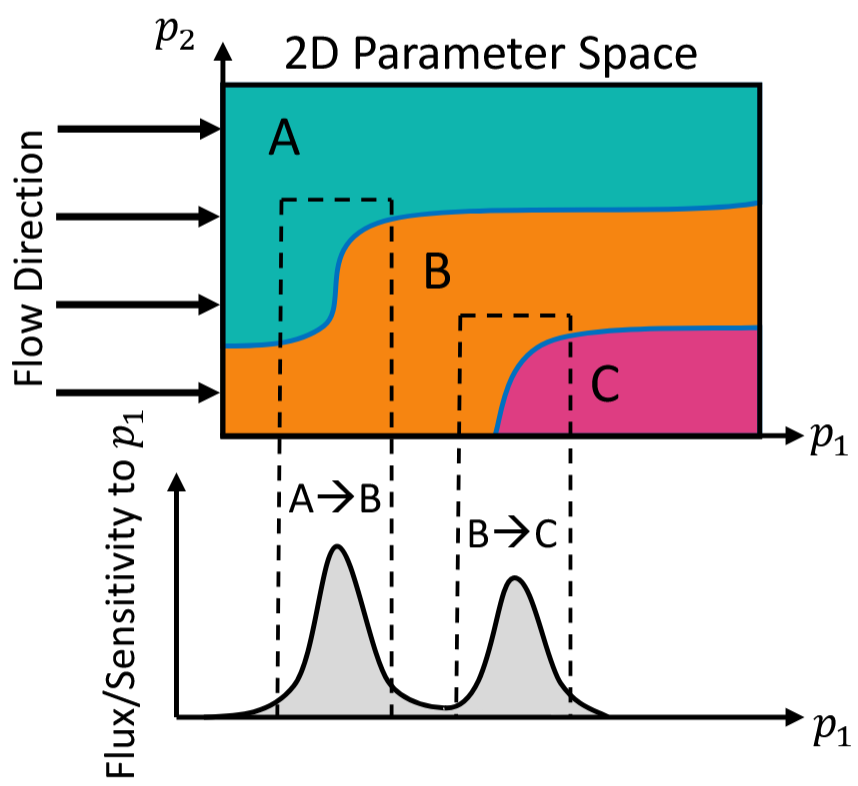 Voronoi Cell Interface-Based Parameter Sensitivity Analysis for Labeled SamplesRuben Bauer, Marina Evers, Quang Quynh Ngo, and 3 more authorsComputer Graphics Forum, 2025
Abstract Varying the input parameters of simulations or experiments often leads to different classes of results. Parameter sensitivity analysis in this context includes estimating the sensitivity to the individual parameters, that is, to understand which parameters contribute most to changes in output classifications and for which parameter ranges these occur. We propose a novel visual parameter sensitivity analysis approach based on Voronoi cell interfaces between the sample points in the parameter space to tackle the problem. The Voronoi diagram of the sample points in the parameter space is first calculated. We then extract Voronoi cell interfaces which we use to quantify the sensitivity to parameters, considering the class label information of each sample’s corresponding output. Multiple visual encodings are then utilized to represent the cell interface transitions and class label distribution, including stacked graphs for local parameter sensitivity. We evaluate the approach’s expressiveness and usefulness with case studies for synthetic and real-world datasets.
@article{bauer2025voronoi, author = {Bauer, Ruben and Evers, Marina and Ngo, Quang Quynh and Reina, Guido and Frey, Steffen and Sedlmair, Michael}, title = {Voronoi Cell Interface-Based Parameter Sensitivity Analysis for Labeled Samples}, journal = {Computer Graphics Forum}, year = {2025}, volume = {0}, number = {0}, pages = {0}, doi = {https://doi.org/10.1111/cgf.70122}, } -
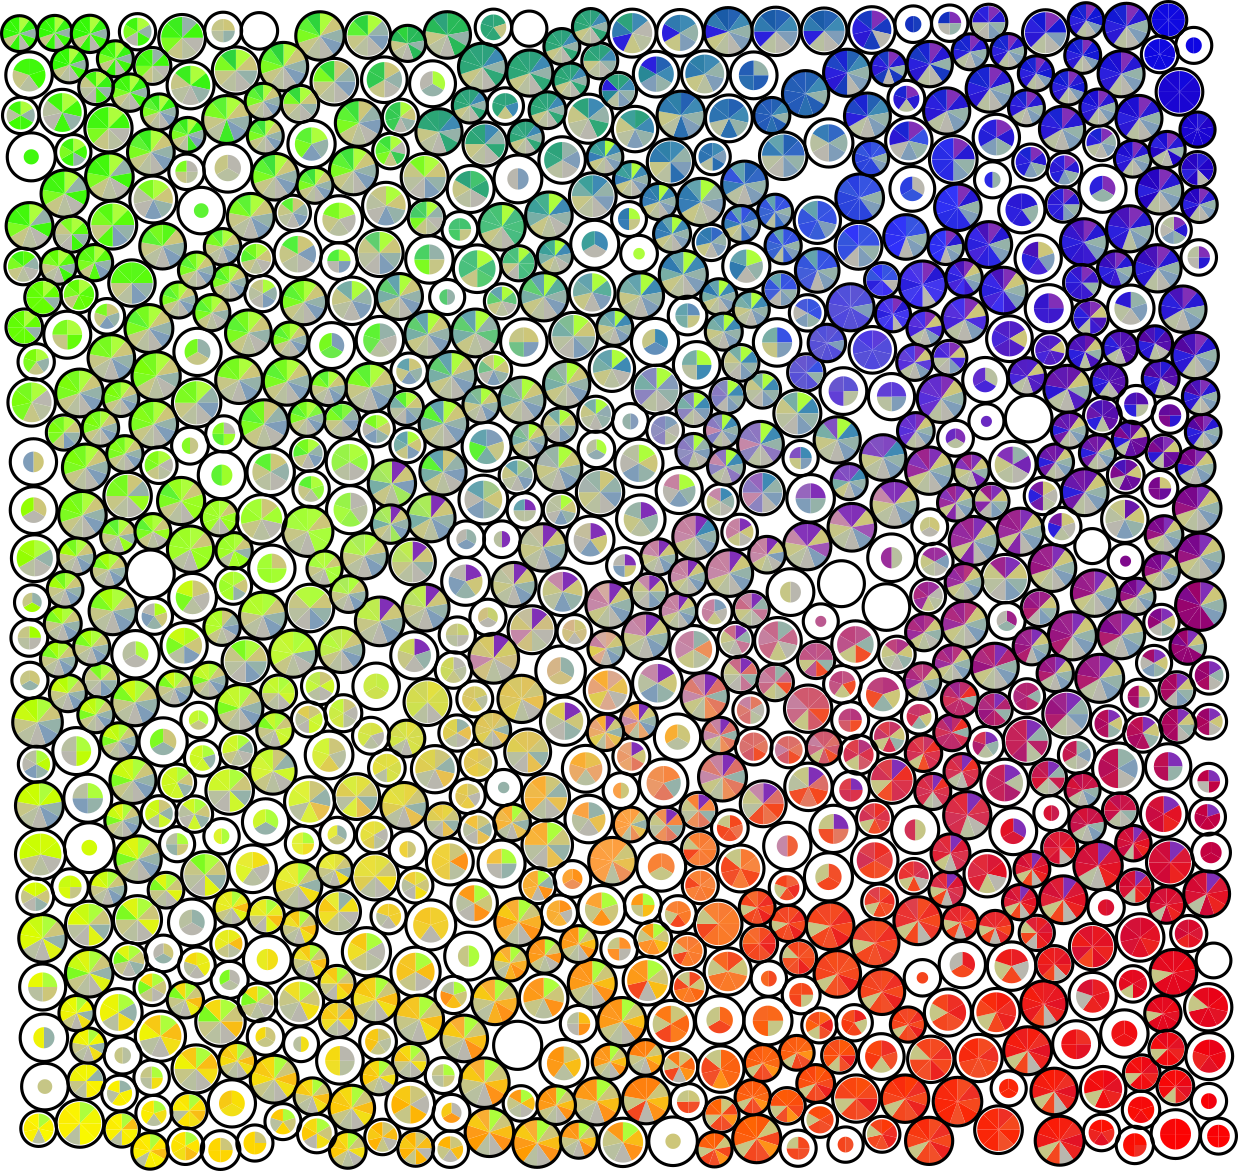 Pie Chart Glyph Visualization of Uncertain Connected ComponentsMarina Evers, Farhan Rasheed, Talha Bin Masood, and 2 more authorsIn EuroVis 2025 - Posters, 2025
Edges of graphs are often associated with uncertainty. The inherent uncertainty of the data also induces uncertainty in derived graph attributes such as connected components. Even for planar graphs, visualizing the connected components in the graph embedding while encoding their uncertainty imposes challenges due to overlap. We present a visual encoding for uncertain connected components in a planar graph embedding. The underlying model does not require matching or assumptions on the overlap of the components and emphasizes uncertain boundary regions. We discuss different design options and show the applicability of our approach based on synthetic data and real-world data on force networks in granular materials.
@inproceedings{10.2312:evp.20251131, booktitle = {EuroVis 2025 - Posters}, editor = {Diehl, Alexandra and Kucher, Kostiantyn and Médoc, Nicolas}, title = {{Pie Chart Glyph Visualization of Uncertain Connected Components}}, author = {Evers, Marina and Rasheed, Farhan and Masood, Talha Bin and Hotz, Ingrid and Weiskopf, Daniel}, year = {2025}, publisher = {The Eurographics Association}, isbn = {978-3-03868-286-8}, doi = {10.2312/evp.20251131}, } -
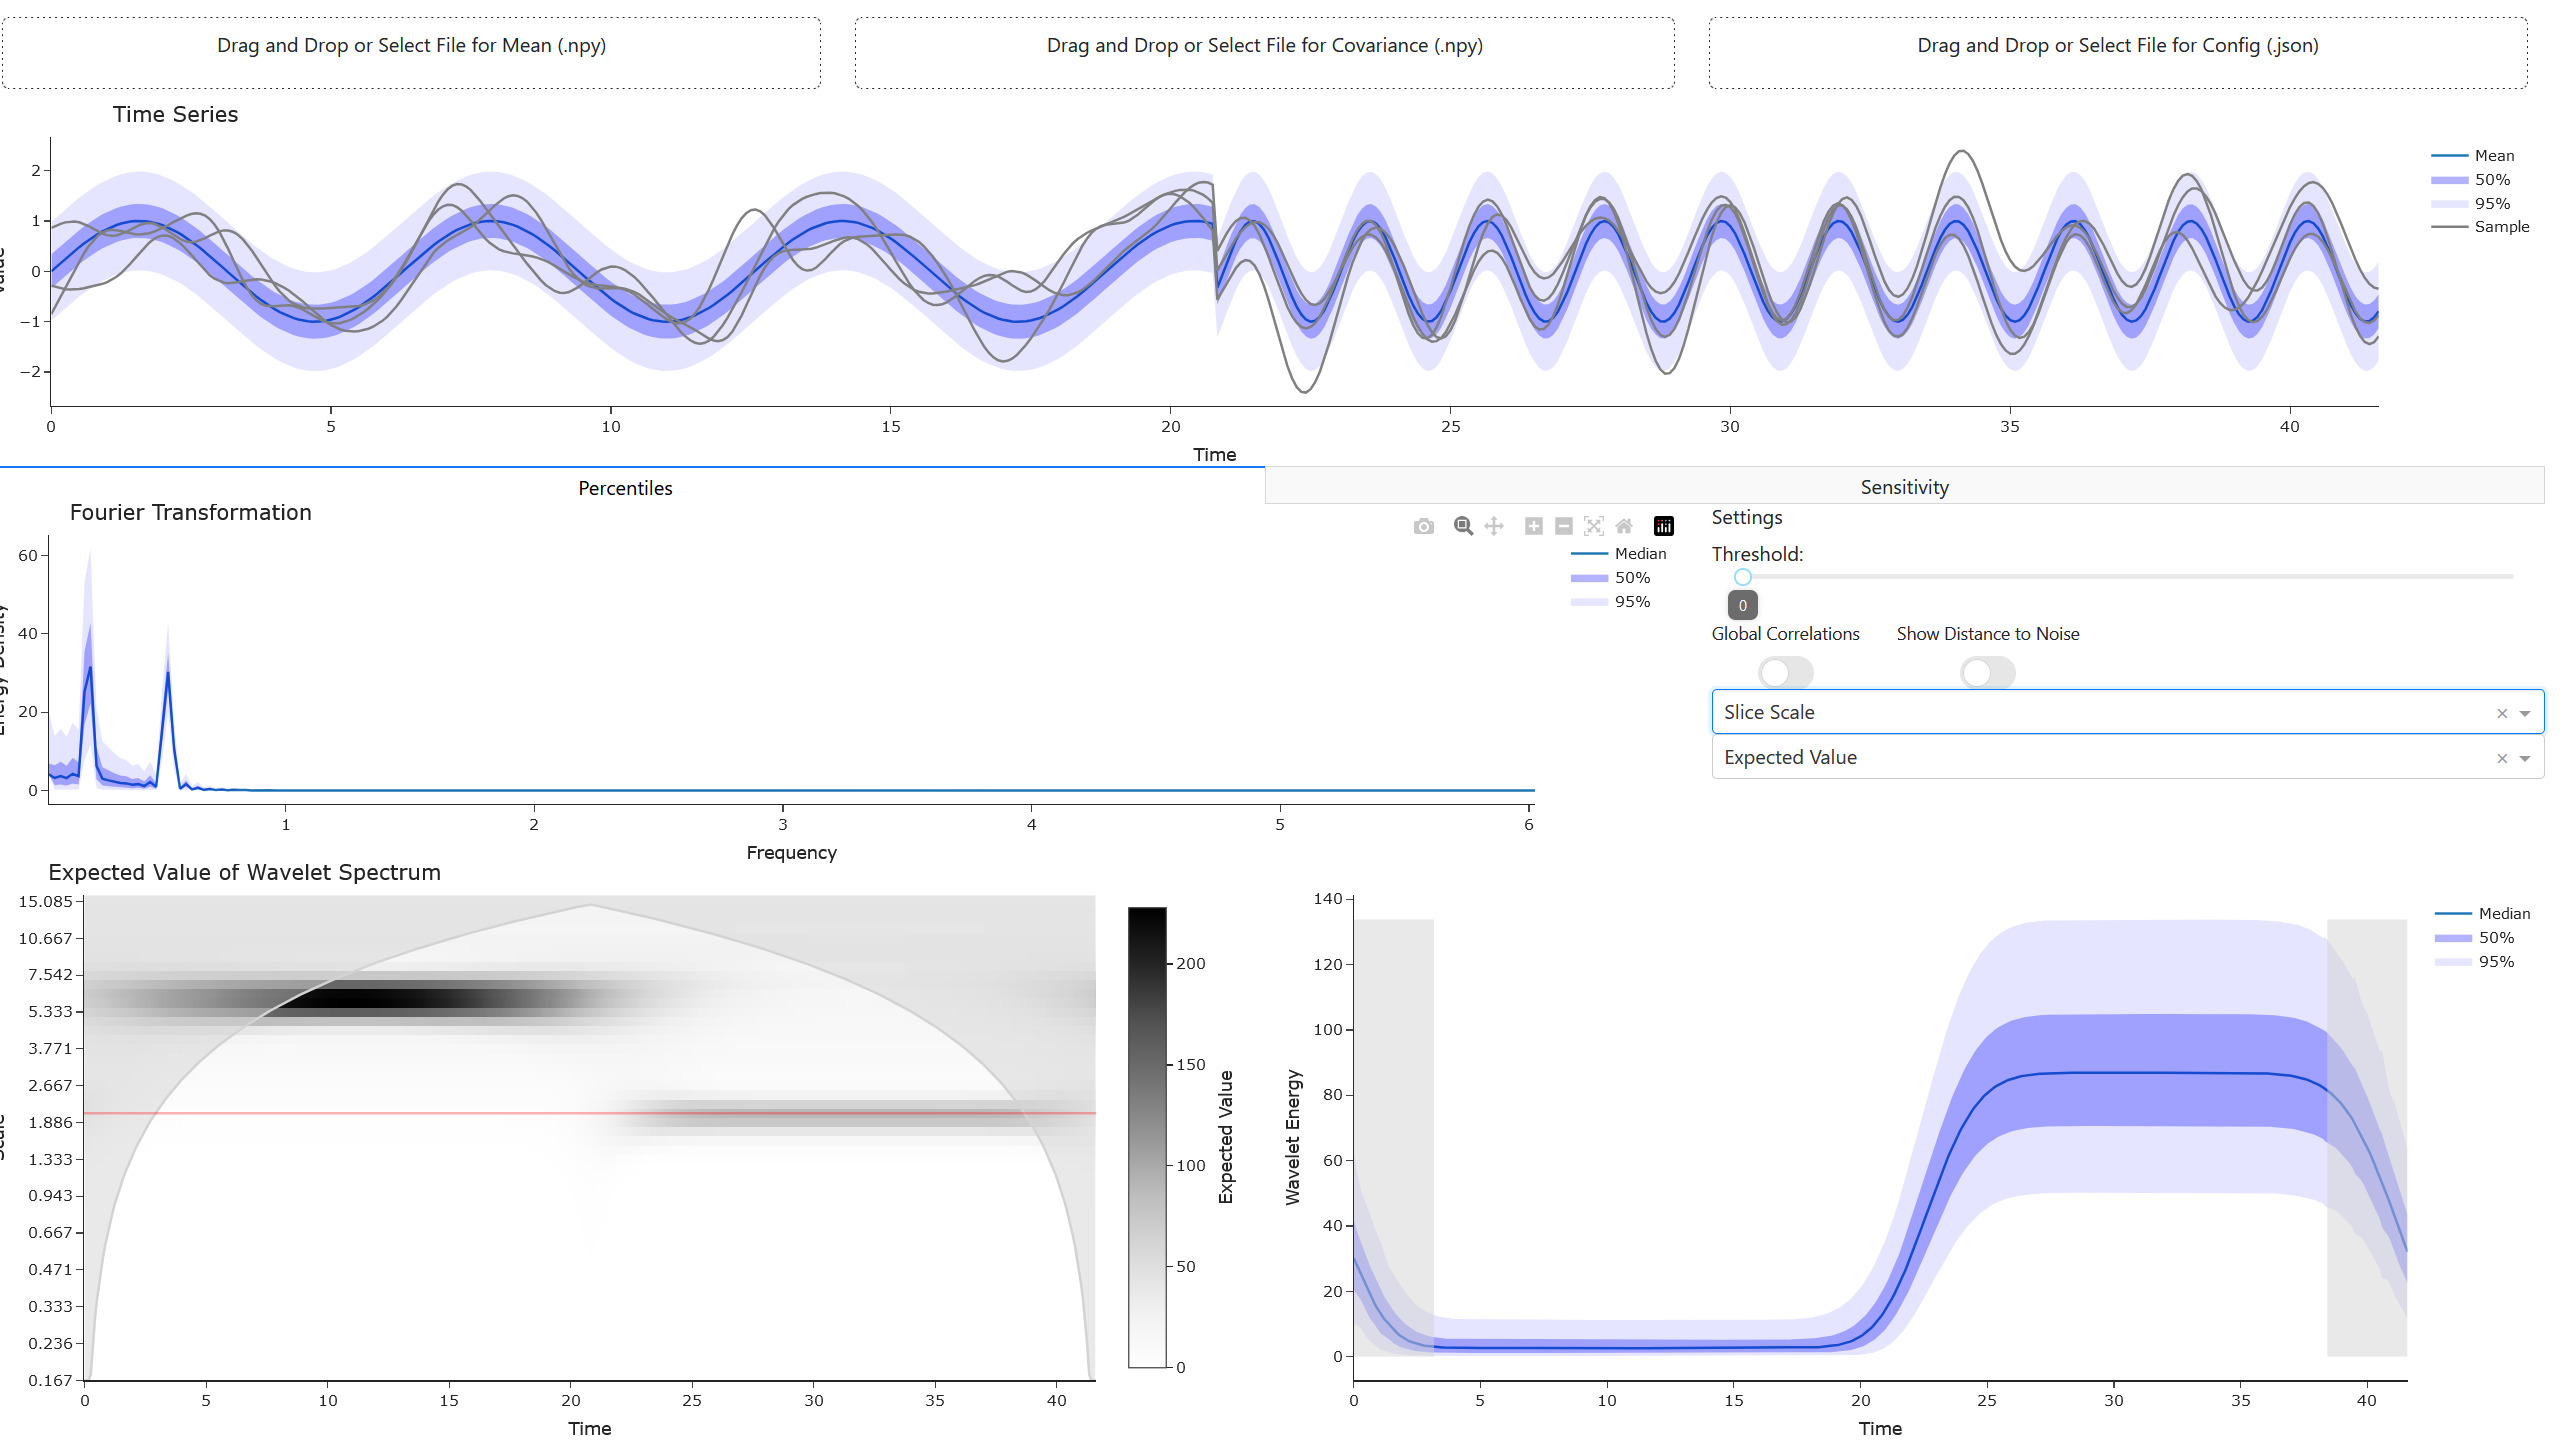 Uncertainty-aware Spectral VisualizationMarina Evers, and Daniel WeiskopfIEEE Transactions on Visualization and Computer Graphics, 2025
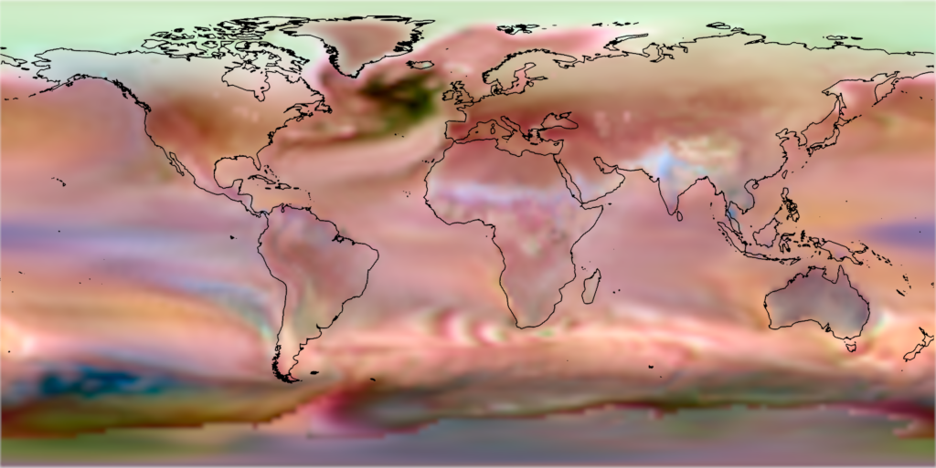
One common task in time series analysis is the visual investigation of spectra such as Fourier spectra or wavelet spectra to identify dominating frequencies. In this paper, we present the propagation of data uncertainty to the spectra and its visualization. We consider the Fourier and continuous wavelet transformations, which are two common spectral analysis methods. Deriving the propagation for time series that can be modeled as a Gaussian process leads to a combination of weighted non-central chi-squared distributions in the spectrum. Percentile-based visualizations explicitly encode the non-normal uncertainty in the 1D Fourier and 2D wavelet spectrum. We enrich the visualization by including correlations, sensitivity, and signal-to-noise analysis. For visual exploration, we combine the different visualizations into an interactive approach that allows for investigating the uncertain time series in the temporal and spectral domains. Finally, we show the usefulness of our approach by applying it to several real-world data sets and by a qualitative interview study with visualization experts.
@article{evers2025uncertainty, author = {Evers, Marina and Weiskopf, Daniel}, journal = {IEEE Transactions on Visualization and Computer Graphics}, title = {Uncertainty-aware Spectral Visualization}, year = {2025}, volume = {31}, number = {10}, pages = {7254 - 7268}, publisher = {IEEE}, doi = {10.1109/TVCG.2025.3542898}, } -
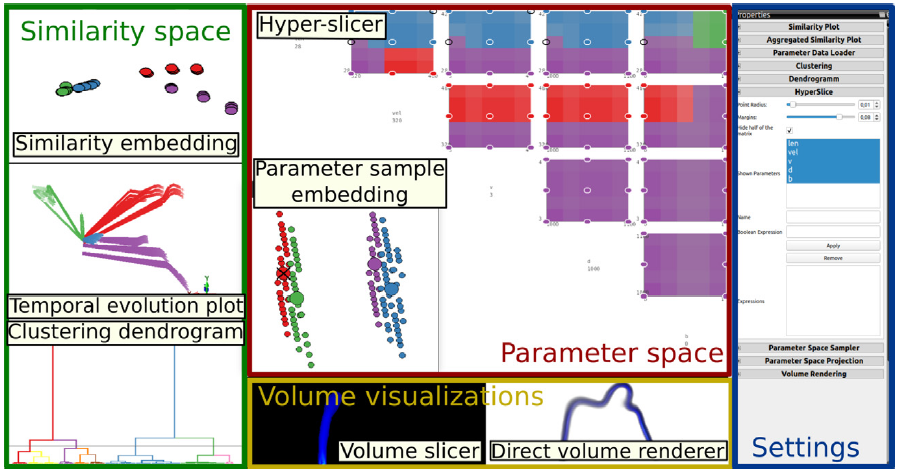
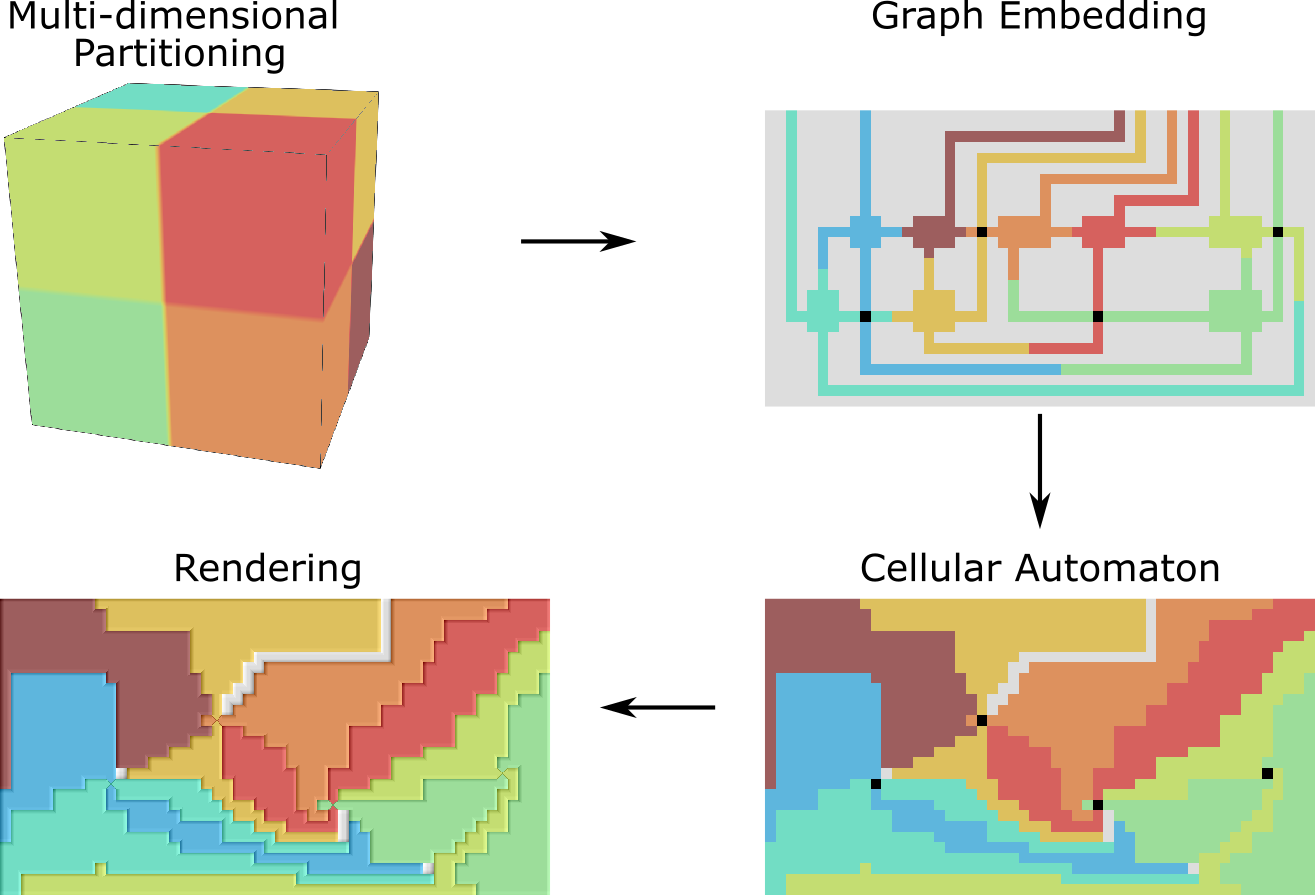 2D Embeddings of Multi-dimensional PartitioningsMarina Evers, and Lars LinsenIEEE Transactions on Visualization and Computer Graphics, 2025
Numerical simulations are commonly used to understand the parameter dependence of given spatio-temporal phenomena. Sampling a multi-dimensional parameter space and running the respective simulations leads to an ensemble of a large number of spatio-temporal simulation runs. A main objective for analyzing the ensemble is to partition (or segment) the multi-dimensional parameter space into connected regions of simulation runs with similar behavior. To facilitate such an analysis, we propose a novel visualization method for multi-dimensional parameter-space partitions. Our visualization is based on the concept of a hyper-slicer, which allows for undistorted views of the parameter-space segments’ extent and transitions. For navigation within the parameter space, interactions with a 2D embedding of the parameter-space samples, including their segment memberships, are supported. Parameter-space partitions are generated in a semi-automatic fashion by analyzing the similarity space of the ensemble’s simulation runs. Clusters of similar simulation runs induce the segments of the parameter-space partition. We link the parameter-space partitioning visualizations to similarity-space visualizations of the ensemble’s simulation runs and embed them into an interactive visual analysis tool that supports the analysis of all facets of the spatio-temporal simulation ensemble targeted at the overarching goal of analyzing the parameter-space partitioning. The partitioning can then be visually analyzed and interactively refined. We evaluated our approach with experts within case studies from three different domains.
@article{evers20242d, title = {2D Embeddings of Multi-dimensional Partitionings}, author = {Evers, Marina and Linsen, Lars}, journal = {IEEE Transactions on Visualization and Computer Graphics}, year = {2025}, volume = {31}, number = {1}, pages = {218-228}, publisher = {IEEE}, doi = {10.1109/TVCG.2024.3456394}, } -
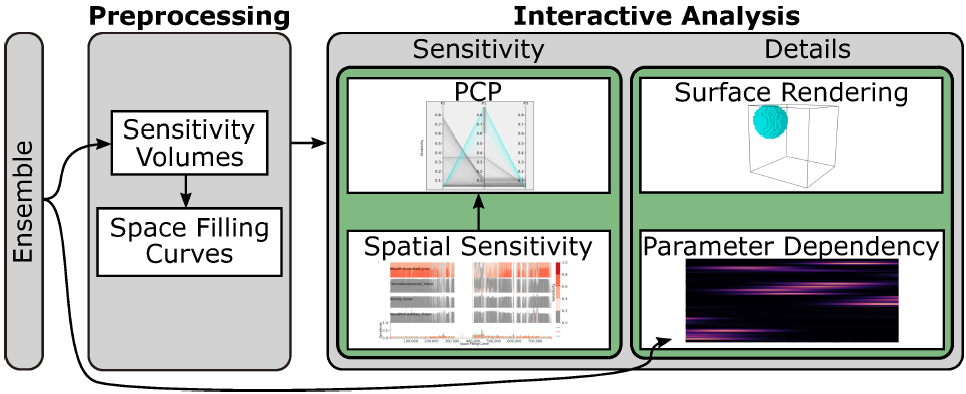 Interactive Visual Analysis of Spatial SensitivitiesMarina Evers, Simon Leistikow, Hennes Rave, and 1 more authorIEEE Transactions on Visualization and Computer Graphics, 2025
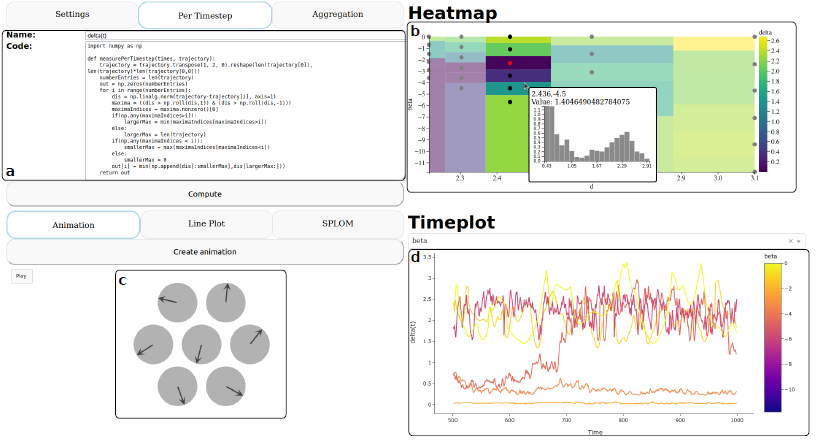
Sensitivity analyses of simulation ensembles determine how simulation parameters influence the simulation’s outcome. Commonly, one global numerical sensitivity value is computed per simulation parameter. However, when considering 3D spatial simulations, the analysis of localized sensitivities in different spatial regions is of importance in many applications. For analyzing the spatial variation of parameter sensitivity, one needs to compute a spatial sensitivity scalar field per simulation parameter. Given n simulation parameters, we obtain multi-field data consisting of n scalar fields when considering all simulation parameters. We propose an interactive visual analytics solution to analyze the multi-field sensitivity data. It supports the investigation of how strongly and in what way individual parameters influence the simulation outcome, in which spatial regions this is happening, and what the interplay of the simulation parameters is. Its central component is an overview visualization of all sensitivity fields that avoids 3D occlusions by linearizing the data using an adapted scheme of data-driven space-filling curves. The spatial sensitivity values are visualized in a combination of a Horizon Graph and a line chart. We validate our approach by applying it to synthetic and real-world ensemble data.
@article{evers2024interactive,
  title = {Interactive Visual Analysis of Spatial Sensitivities},
  author = {Evers, Marina and Leistikow, Simon and Rave, Hennes and Linsen, Lars},
  journal = {IEEE Transactions on Visualization and Computer Graphics},
  year = {2025},
  volume = {31},
  number = {9},
  pages = {5101-5115},
  publisher = {IEEE},
  doi = {10.1109/TVCG.2024.3433001},
}


2024
-
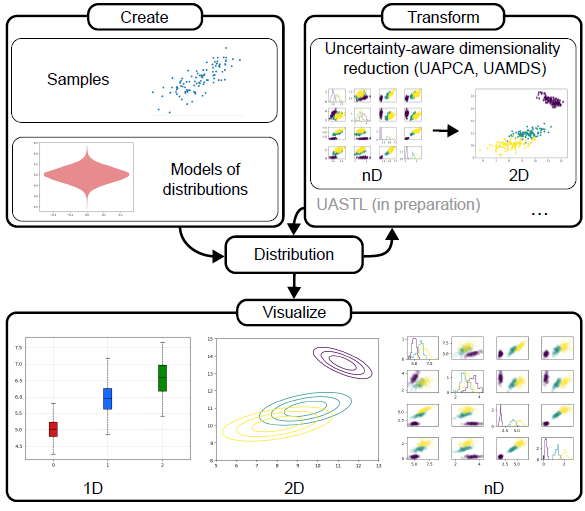 UADAPy: An Uncertainty-Aware Visualization and Analysis ToolboxPatrick Paetzold, David Hägele, Marina Evers, and 2 more authorsIn 2024 IEEE Workshop on Uncertainty Visualization: Applications, Techniques, Software, and Decision Frameworks, 2024
Current research provides methods to communicate uncertainty and adapts classical algorithms of the visualization pipeline to take the uncertainty into account. Various existing visualization frameworks include methods to present uncertain data but do not offer transformation techniques tailored to uncertain data. Therefore, we propose a software package for uncertainty-aware data analysis in Python (UADAPy) offering methods for uncertain data along the visualization pipeline. We aim to provide a platform that is the foundation for further integration of uncertainty algorithms and visualizations. It provides common utility functionality to support research in uncertainty-aware visualization algorithms and makes state-of-the-art research results accessible to the end user. The project is available at https://github.com/UniStuttgart-VISUS/uadapy.
@inproceedings{paetzold2024uadapy, title = {UADAPy: An Uncertainty-Aware Visualization and Analysis Toolbox}, author = {Paetzold, Patrick and H{\"a}gele, David and Evers, Marina and Weiskopf, Daniel and Deussen, Oliver}, booktitle = {2024 IEEE Workshop on Uncertainty Visualization: Applications, Techniques, Software, and Decision Frameworks}, pages = {48--50}, year = {2024}, organization = {IEEE}, doi = {10.1109/UncertaintyVisualization63963.2024.00011}, } -
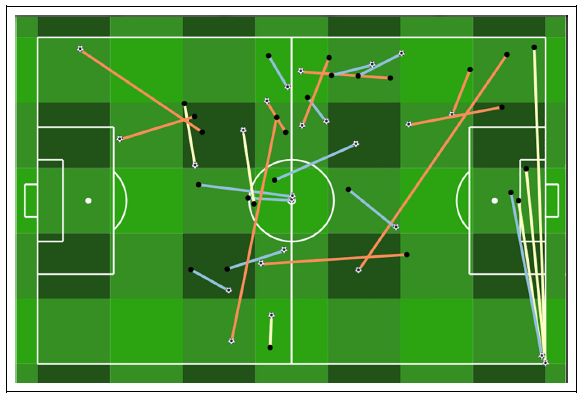 Visual analytics of soccer player performance using objective ratingsMarina Evers, Adrian Derstroff, Simon Leistikow, and 9 more authorsInformation Visualization, 2024
The performance of soccer players is commonly rated by soccer experts for each match as well as over a tournament or during a season/year. However, these ratings are mostly subjective. We instead propose a visual analytics approach for a more objective, data-driven analysis of soccer players’ performances. We introduce data-driven ratings for various aspects, which can be combined by interactively assigning weights to compute an overall score as well as individual scores for passes, duels, and shots. Our tool supports comparative visualizations at a global level that can be adapted to different analysis tasks as well as in-detail analyses of individual events of the game. We apply our approach to data gathered during the 2020 UEFA European Football Championship and perform in-detail analyses of individual players in selected matches.
@article{soccer, author = {Evers, Marina and Derstroff, Adrian and Leistikow, Simon and Schneider, Tom and Mallepree, Larissa and Stampke, Jan and Leisgang, Moritz and Sprafke, Sebastian and Schuhl, Melina and Krefft, Niklas and Droese, Felix and Linsen, Lars}, title = {Visual analytics of soccer player performance using objective ratings}, journal = {Information Visualization}, volume = {23}, number = {2}, pages = {142-156}, year = {2024}, doi = {10.1177/14738716231220539} } -
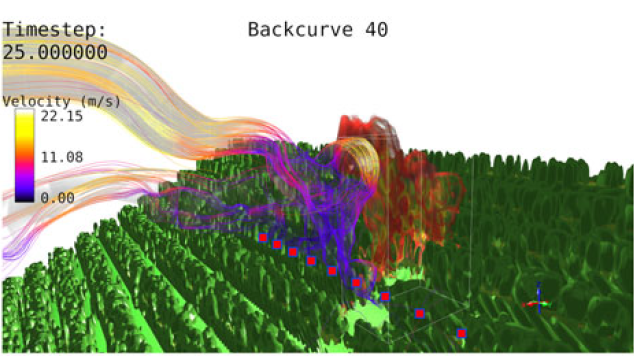 2022 IEEE Scientific Visualization Contest Winner: Multifield Analysis of Vorticity-Driven Lateral Spread in Wildfire EnsemblesGabriel Borrelli, Lars Hagemann, Jannik Steinkühler, and 7 more authorsIEEE Computer Graphics and Applications, 2024
We present an interactive visual analysis tool for analyzing the spread of wildfires and what influences their evolution. Multiple time-varying 3-D scalar and vector fields are investigated and related to each other to identify causes of atypical fire spread. We present a visual analysis approach that allows for a comparative analysis of multiple runs of a simulation ensemble on different levels of detail. Overview visualizations combined with volume renderings and flow visualizations provide an intuitive understanding of the fire spread.
@article{scivis2022, author = {Borrelli, Gabriel and Hagemann, Lars and Steinkühler, Jannik and Derstroff, Adrian and Evers, Marina and Huesmann, Karim and Leistikow, Simon and Rave, Hennes and Gol, Reyhaneh Sabbagh and Linsen, Lars}, journal = {IEEE Computer Graphics and Applications}, title = {2022 IEEE Scientific Visualization Contest Winner: Multifield Analysis of Vorticity-Driven Lateral Spread in Wildfire Ensembles}, year = {2024}, volume = {44}, number = {1}, pages = {40-49}, doi = {10.1109/MCG.2023.3310298} } -
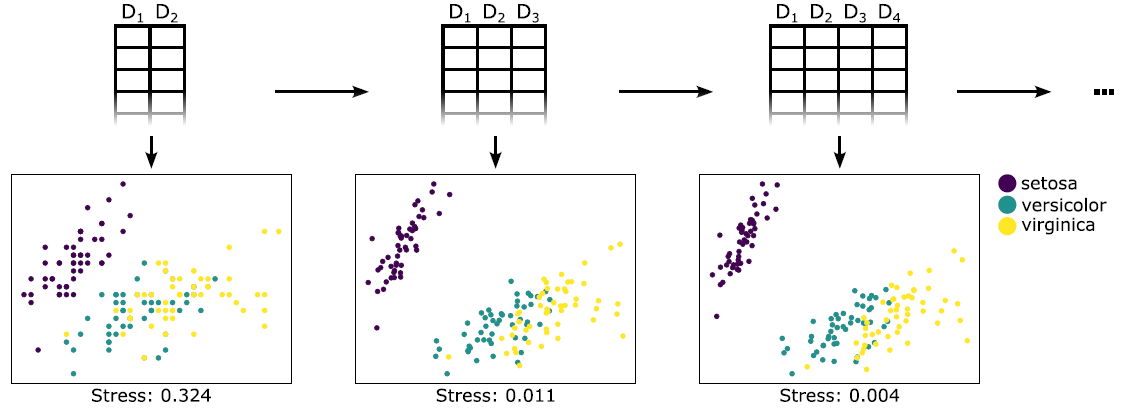 Progressive Glimmer: Expanding Dimensionality in Multidimensional ScalingMarina Evers, David Hägele, Sören Döring, and 1 more authorIn IEEE VIS Workshop on Progressive Data Analysis and Visualization, 2024
Progressive dimensionality reduction algorithms allow for visually investigating intermediate results, especially for large data sets. While different algorithms exist that progressively increase the number of data points, we propose an algorithm that allows for increasing the number of dimensions. Especially in spatio-temporal data, where each spatial location can be seen as one data point and each time step as one dimension, the data is often stored in a format that supports quick access to the individual dimensions of all points. Therefore, we propose Progressive Glimmer, a progressive multidimensional scaling (MDS) algorithm. We adapt the Glimmer algorithm to support progressive updates for changes in the data’s dimensionality. We evaluate Progressive Glimmer’s embedding quality and runtime. We observe that the algorithm provides more stable results, leading to visually consistent results for progressive rendering and making the approach applicable to streaming data. We show the applicability of our approach to spatio-temporal simulation ensemble data where we add the individual ensemble members progressively.
@inproceedings{evers2024progressive, title = {Progressive Glimmer: Expanding Dimensionality in Multidimensional Scaling}, author = {Evers, Marina and H{\"a}gele, David and D{\"o}ring, S{\"o}ren and Weiskopf, Daniel}, booktitle = {IEEE VIS Workshop on Progressive Data Analysis and Visualization}, year = {2024}, doi = {https://doi.org/10.48550/arXiv.2410.19430} } -
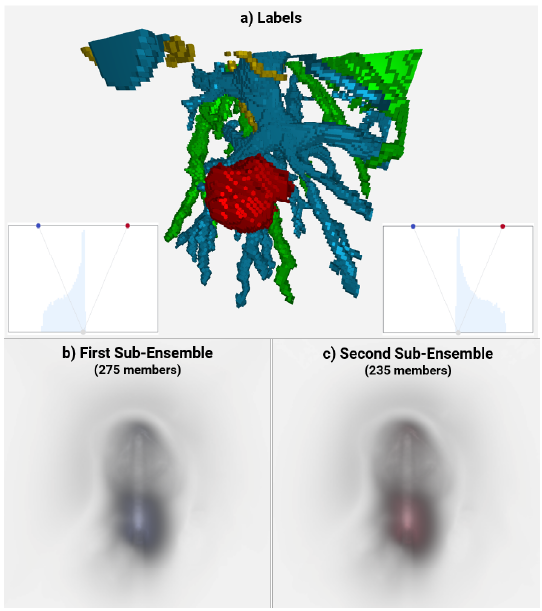 Region-based Visualization in Hierarchically Clustered Ensemble VolumesHennes Rave, Marina Evers, Tim Gerrits, and 1 more authorIn Vision, Modeling, and Visualization, 2024
Ensembles of simulations are generated to capture uncertainties in the simulation model and its initialization. When simulating 3D spatial phenomena, the value distributions may vary from region to region. Therefore, visualization methods need to adapt to different types and shapes of statistical distributions across regions. In the case of normal distribution, a region is well represented and visualized by the means and standard deviations. In the case of multi-modal distributions, the ensemble can be subdivided to investigate whether sub-ensembles exhibit uni-modal distributions in that region. We, therefore, propose an interactive visual analysis approach for region-based visualization within a hierarchy of sub-ensembles. The hierarchy of sub-ensembles is created using hierarchical clustering, while regions can be defined using parallel coordinates of statistical properties. The identified regions are rendered in a hierarchy of interactive volume renderers. We apply our approach to two real-world simulation ensembles to show its usability.
@inproceedings{10.2312:vmv.20241206, booktitle = {Vision, Modeling, and Visualization}, editor = {Linsen, Lars and Thies, Justus}, title = {{Region-based Visualization in Hierarchically Clustered Ensemble Volumes}}, author = {Rave, Hennes and Evers, Marina and Gerrits, Tim and Linsen, Lars}, year = {2024}, publisher = {The Eurographics Association}, isbn = {978-3-03868-247-9}, doi = {10.2312/vmv.20241206} } -
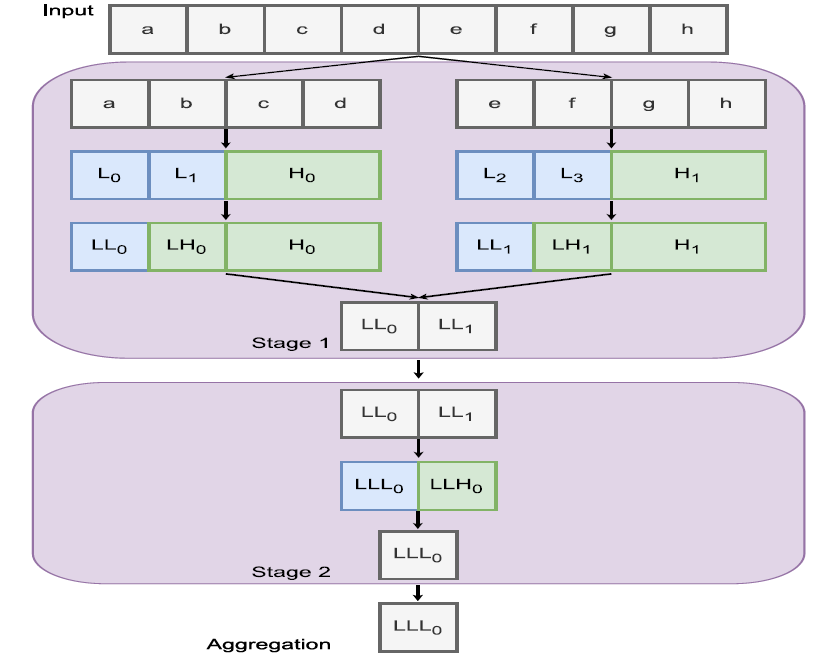 Efficient Adaptive Multiresolution Aggregations of Spatio-temporal EnsemblesGabriel Borrelli, Marina Evers, and Lars LinsenIn Eurographics Symposium on Parallel Graphics and Visualization, 2024
Spatio-temporal ensemble data consist of several simulation runs with multiple spatial and a temporal dimension, where the runs are obtained using different parameter settings or initial conditions for the simulation. During analysis, one is interested in investigating the different facets of space, time, and parameter values. When globally analyzing some facet(s), others shall be aggregated to generate summary visualizations. Due to the large amount of data that an ensemble consists of, one may want to generate summary visualizations at multiple levels of detail. Wavelet transforms are a well-known concept for efficiently switching between multiple resolutions. We propose to extend this concept to ensemble data, where individual facets may be aggregated adaptively. We present how to apply the scheme for any data sizes to generate correct averages even when the number of samples is not a power of two in each dimension. We further develop an out-of-core strategy to handle large data sizes. Our scheme is coupled with common 1D, 2D, and 3D visualization methods for an interactive visual analysis of the ensemble data.
@inproceedings{10.2312:pgv.20241128,
  booktitle = {Eurographics Symposium on Parallel Graphics and Visualization},
  editor = {Reina, Guido and Rizzi, Silvio},
  title = {{Efficient Adaptive Multiresolution Aggregations of Spatio-temporal Ensembles}},
  author = {Borrelli, Gabriel and Evers, Marina and Linsen, Lars},
  year = {2024},
  publisher = {The Eurographics Association},
  issn = {1727-348X},
  isbn = {978-3-03868-243},
  doi = {10.2312/pgv.20241128}
}


2023
-
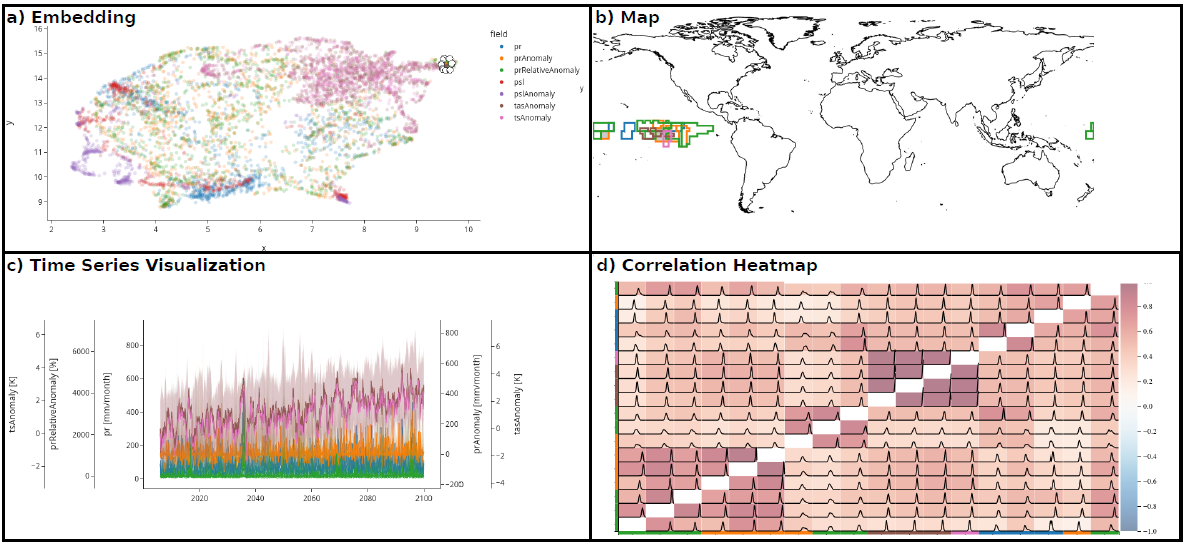 Interactive Visual Analysis of Regional Time Series Correlation in Multi-field Climate EnsemblesMarina Evers, Michael Böttinger, and Lars LinsenIn Workshop on Visualisation in Environmental Sciences (EnvirVis), 2023
Spatio-temporal multi-field data resulting from ensemble simulations are commonly used in climate research to investigate possible climatic developments and their certainty. One analysis goal is the investigation of possible correlations among different spatial regions in the different fields to find regions of related behavior. We propose an interactive visual analysis approach that focuses on the analysis of correlations in spatio-temporal ensemble data. Our approach allows for finding correlations between spatial regions in different fields. Detection of clusters of strongly correlated spatial regions is supported by lower-dimensional embeddings. Then, groups can be selected and investigated in detail, e.g., to study the temporal evolution of the selected group, their Fourier spectra or the distribution of the correlations over the different ensemble members. We apply our approach to selected 2D scalar fields of a large ensemble climate simulation and demonstrate the utility of our tool with several use cases.
@inproceedings{eversInteractiveVisualAnalysis2023, title = {Interactive Visual Analysis of Regional Time Series Correlation in Multi-field Climate Ensembles}, booktitle = {Workshop on Visualisation in Environmental Sciences (EnvirVis)}, publisher = {The Eurographics Association}, author = {Evers, Marina and Böttinger, Michael and Linsen, Lars}, year = {2023}, doi = {10.2312/envirvis.20231108}, } -
 An active colloidal system showing parallels to a time crystalMarina Evers, and Raphael WittkowskiPhysica Scripta, 2023
The spontaneous breaking of symmetries is a widespread phenomenon in physics. When time translational symmetry is spontaneously broken, an exotic nonequilibrium state of matter in which the same structures repeat themselves in time can arise. This state, known as ‘time crystal’, attracted a lot of interest recently. Another relatively new research area deals with active matter. Materials consisting of colloidal particles that consume energy from their environment and propel themselves forward can exhibit intriguing properties like superfluidity that were previously known only from quantum-mechanical systems. Here, we bring together these—at first glance completely different—research fields by showing that self-propelled colloidal particles show parallels to classical continuous time crystals. We present a state diagram showing where this state of matter arises. Furthermore, we investigate its properties and analyze the interactions between the particles leading to the dynamics.
@article{Evers_2023, doi = {10.1088/1402-4896/ad05ab}, year = {2023}, publisher = {IOP Publishing}, volume = {98}, number = {12}, pages = {125240}, author = {Evers, Marina and Wittkowski, Raphael}, title = {An active colloidal system showing parallels to a time crystal}, journal = {Physica Scripta}, } -
 Interactive Visual Analysis Parameter-Space and Correlation Analysis of Spatio-Temporal Simulation EnsemblesMarina EversUniversity of Münster, 2023
Numerical simulations are commonly used to model spatio-temporal phenomena across different domains, including physics, climate science, and medicine. The individual simulation results often vary over space and time but might also contain different fields. Simulations are run several times with different input parameters and initial conditions to capture their influence. The resulting set of simulation runs is called a simulation ensemble. Such simulation ensembles capture the uncertainty induced by the initial conditions or unknown parameter settings but can also be used to investigate how the parameters influence the simulation outcome. However, simulation ensembles contain large amounts of complex data, which makes them challenging to analyze. To obtain a comprehensive understanding of the data, visual analysis approaches combine automatic methods with the expert knowledge of the scientist. This thesis presents interactive visual approaches targeting different facets of the analysis of simulation ensembles. Applications to simulation ensembles from the domains of physics, climate science, and medicine as well as feedback from experts in the respective domains show the utility of our approaches. The first part of the thesis concentrates on exploring the parameter space to understand how different parameters influence the simulation output and identify the most important ones. An interactive method for semi-automatically partitioning the multi-dimensional parameter space into regions with similar simulation outcomes is proposed. This multidimensional partitioning can be investigated in a distortion-free visualization that allows for seeing the partitions’ extent and obtaining a geometrical understanding. Furthermore, we also propose a 2D embedding that provides an overview of the partitioning and preserves its topology, the partitions’ sizes, and boundaries. Interactive measure definitions support a flexible, domain-specific analysis of the parameter space. Coherent topological landscapes allow for understanding the topological variations in the dependency of the input parameters. While these approaches focus on qualitative parameter-space analysis, we introduce an interactive visual approach for analyzing the quantitative sensitivity in different spatial regions. The second part of the thesis targets the analysis of correlations between different spatial regions to study, in particular, long-range phenomena in climate science like the El Niño phenomenon. Based on a summary visualization of the correlations covering the entire simulation ensemble, uncertainty-aware visual analysis approaches allow for investigating the correlations on different levels of detail.
@phdthesis{eversDissertation2023,
  title = {Interactive Visual Analysis Parameter-Space and Correlation Analysis of Spatio-Temporal Simulation Ensembles},
  author = {Evers, Marina},
  year = {2023},
  school = {University of Münster},
}


2022
-
 Multi-dimensional parameter-space partitioning of spatio-temporal simulation ensemblesMarina Evers, and Lars LinsenComputers & Graphics, 2022
@article{eversMultidimensionalParameterspacePartitioning2022, title = {Multi-dimensional parameter-space partitioning of spatio-temporal simulation ensembles}, volume = {104}, journal = {Computers \& Graphics}, author = {Evers, Marina and Linsen, Lars}, year = {2022}, pages = {140--151}, doi = {https://doi.org/10.1016/j.cag.2022.04.005} } -
 ASEVis: Visual Exploration of Active System Ensembles to Define Characteristic MeasuresMarina Evers, Raphael Wittkowski, and Lars LinsenIn 2022 IEEE Visualization and Visual Analytics (VIS), 2022
Simulation ensembles are a common tool in physics for understanding how a model outcome depends on input parameters. We analyze an active particle system, where each particle can use energy from its surroundings to propel itself. A multi-dimensional feature vector containing all particles’ motion information can describe the whole system at each time step. The system’s behavior strongly depends on input parameters like the propulsion mechanism of the particles. To understand how the time-varying behavior depends on the input parameters, it is necessary to introduce new measures to quantify the difference of the dynamics of the ensemble members. We propose a tool that supports the interactive visual analysis of time-varying feature-vector ensembles. A core component of our tool allows for the interactive definition and refinement of new measures that can then be used to understand the system’s behavior and compare the ensemble members. Different visualizations support the user in finding a characteristic measure for the system. By visualizing the user-defined measure, the user can then investigate the parameter dependencies and gain insights into the relationship between input parameters and simulation output.
@inproceedings{eversASEVisVisualExploration2022, title = {{ASEVis}: {Visual} Exploration of Active System Ensembles to Define Characteristic Measures}, booktitle = {2022 IEEE Visualization and Visual Analytics (VIS)}, author = {Evers, Marina and Wittkowski, Raphael and Linsen, Lars}, year = {2022}, pages = {150--154}, doi = {10.1109/VIS54862.2022.00039}, } -
 Coherent Topological Landscapes for Simulation EnsemblesMarina Evers, Maria Herick, Vladimir Molchanov, and 1 more authorIn International Joint Conference on Computer Vision, Imaging and Computer Graphics, 2022
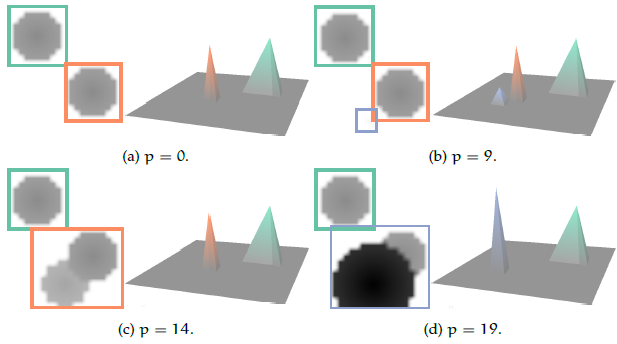
The topological structure is an intrinsic feature of a scalar field of any spatial dimensionality. The dependence of the topology on the isovalue of the field can be represented in the form of merge and split trees, which are usually combined to a contour tree. Topological landscapes are algorithmically constructed 2D scalar fields, which have the same topological structure (and, therefore, correspond to the same contour tree) as the given multidimensional scalar field and serve as an intuitive low-dimensional depiction of its topological features. Topological landscapes computed for a set of scalar fields, e.g., created by varying over time or by varying simulation parameter values in a simulation ensemble, are not necessarily coherent among themselves. Therefore, a comparative analysis of topology in an ensemble is hindered. We propose a concept for the generation of coherent contour trees for simulation ensembles that is based on merging contour trees of all scalar fields of the ensemble. The coherent contour tree can be exploited to generate coherent topological landscapes. Visual analysis of varying scalar field topology is, then, supported by animating landscapes or by volume rendering of a stack of temporal slices representing color-coded landscapes. We apply the proposed methodology to synthetic data for evaluation purposes as well as to 2D and 3D simulation ensemble data.
@inproceedings{evers2020coherent, title = {Coherent Topological Landscapes for Simulation Ensembles}, author = {Evers, Marina and Herick, Maria and Molchanov, Vladimir and Linsen, Lars}, booktitle = {International Joint Conference on Computer Vision, Imaging and Computer Graphics}, pages = {223--237}, year = {2022}, organization = {Springer}, doi = {10.1007/978-3-030-94893-1_10} } -
 Studying the Effect of Tissue Properties on Radiofrequency Ablation by Visual Simulation Ensemble AnalysisKarl Heimes, Marina Evers, Tim Gerrits, and 4 more authorsIn Eurographics Workshop on Visual Computing for Biology and Medicine, 2022
Honorable Mention
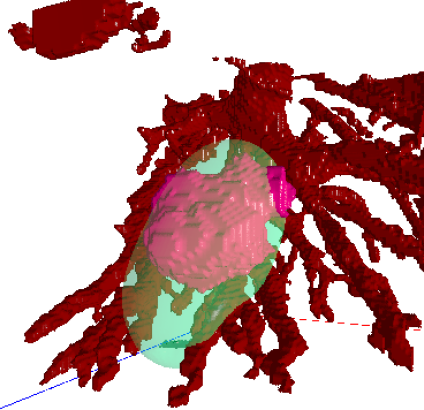
Radiofrequency ablation is a minimally invasive, needle-based medical treatment to ablate tumors by heating due to absorption of radiofrequency electromagnetic waves. To ensure the complete target volume is destroyed, radiofrequency ablation simulations are required for treatment planning. However, the choice of tissue properties used as parameters during simulation induce a high uncertainty, as the tissue properties are strongly patient-dependent. To capture this uncertainty, a simulation ensemble can be created. Understanding the dependency of the simulation outcome on the input parameters helps to create improved simulation ensembles by focusing on the main sources of uncertainty and, thus, reducing computation costs. We present an interactive visual analysis tool for radiofrequency ablation simulation ensembles to target this objective. Spatial 2D and 3D visualizations allow for the comparison of ablation results of individual simulation runs and for the quantification of differences. Simulation runs can be interactively selected based on a parallel coordinates visualization of the parameter space. A 3D parameter space visualization allows for the analysis of the ablation outcome when altering a selected tissue property for the three tissue types involved in the ablation process. We discuss our approach with domain experts working on the development of new simulation models and demonstrate the usefulness of our approach for analyzing the influence of different tissue properties on radiofrequency ablations.
@inproceedings{heimes2022studying, title = {Studying the Effect of Tissue Properties on Radiofrequency Ablation by Visual Simulation Ensemble Analysis}, author = {Heimes, Karl and Evers, Marina and Gerrits, Tim and Gyawali, Sandeep and Sinden, David and Preusser, Tobias and Linsen, Lars}, editor = {Raidou, Renata G. and Sommer, Björn and Kuhlen, Torsten W. and Krone, Michael and Schultz, Thomas and Wu, Hsiang-Yun}, booktitle = {Eurographics Workshop on Visual Computing for Biology and Medicine}, pages = {53--63}, year = {2022}, publisher = {The Eurographics Association}, issn = {2070-5786}, isbn = {978-3-03868-177-9}, doi = {10.2312/vcbm.20221187} } -
 How Wildfires Spread and Why: Visual Multi-field Analysis of Vorticity-driven Lateral Spread EnsemblesGabriel Borrelli, Lars Hagemann, Jannik Steinkühler, and 7 more authorsIn SciVis Contest 2022, 2022
Winning Entry of the IEEE Scientific Visualization Contest 2022
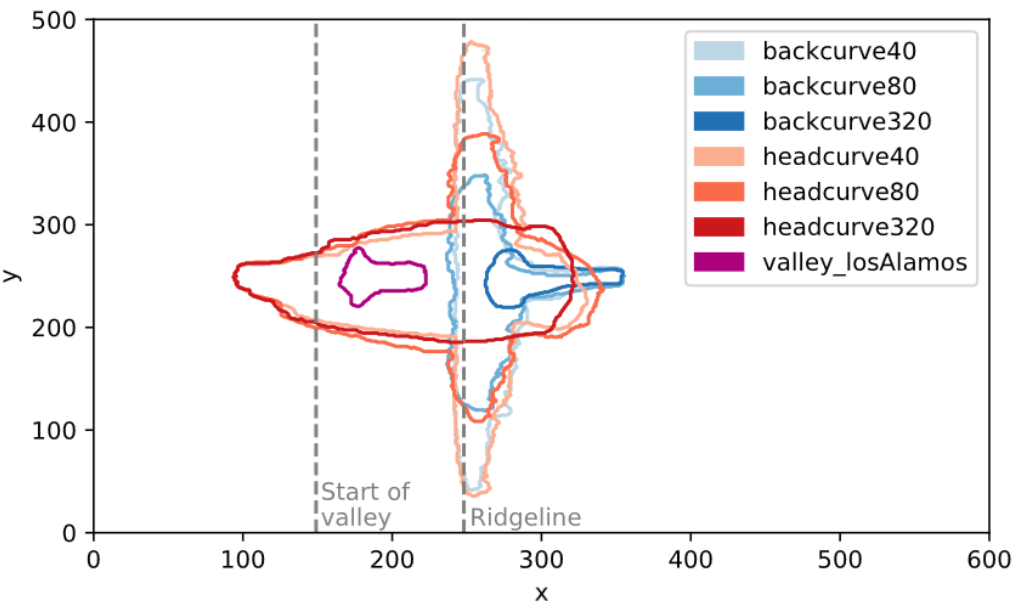
We present an interactive visual analysis tool for the spread of wildfires and what influences their evolution. Multiple spatio-temporal scalar and vector fields are investigated and related to each other to identify causes of atypical fire spread. Our tool allows for the comparative analysis of multiple runs of a simulation ensemble.
@inproceedings{scivisContest2022Entry,
  booktitle = {SciVis Contest 2022},
  title = {How Wildfires Spread and Why: Visual Multi-field Analysis of Vorticity-driven Lateral Spread Ensembles},
  author = {Borrelli, Gabriel and Hagemann, Lars and Steinkühler, Jannik and Derstroff, Adrian and Evers, Marina and Huesmann, Karim and Leistikow, Simon and Rave, Hennes and Sabbagh Gol, Reyhaneh and Linsen, Lars},
  year = {2022},
  publisher = {IEEE}
}


2021
-
 Uncertainty-aware Visualization of Regional Time Series Correlation in Spatio-temporal EnsemblesMarina Evers*, Karim Huesmann*, and Lars LinsenComputer Graphics Forum, 2021
Given a time-varying scalar field, the analysis of correlations between different spatial regions, i.e., the linear dependence of time series within these regions, provides insights into the structural properties of the data. In this context, regions are connected components of the spatial domain with high time series correlations. The detection and analysis of such regions is often performed globally, which requires pairwise correlation computations that are quadratic in the number of spatial data samples. Thus, operations based on all pairwise correlations are computationally demanding, especially when dealing with ensembles that model the uncertainty in the spatio-temporal phenomena using multiple simulation runs. We propose a two-step procedure: In a first step, we map the spatial samples to a 3D embedding based on a pairwise correlation matrix computed from the ensemble of time series. The 3D embedding allows for a one-to-one mapping to a 3D color space such that the outcome can be visually investigated by rendering the colors for all samples in the spatial domain. In a second step, we generate a hierarchical image segmentation based on the color images. From then on, we can visually analyze correlations of regions at all levels in the hierarchy within an interactive setting, which includes the uncertainty-aware analysis of the region’s time series correlation and respective time lags.
@article{evers2021uncertainty, title = {Uncertainty-aware Visualization of Regional Time Series Correlation in Spatio-temporal Ensembles}, author = {Evers, Marina and Huesmann, Karim and Linsen, Lars}, journal = {Computer Graphics Forum}, volume = {40}, number = {3}, pages = {519--530}, year = {2021}, organization = {Wiley Online Library}, doi = {https://doi.org/10.1111/cgf.14326}, } -
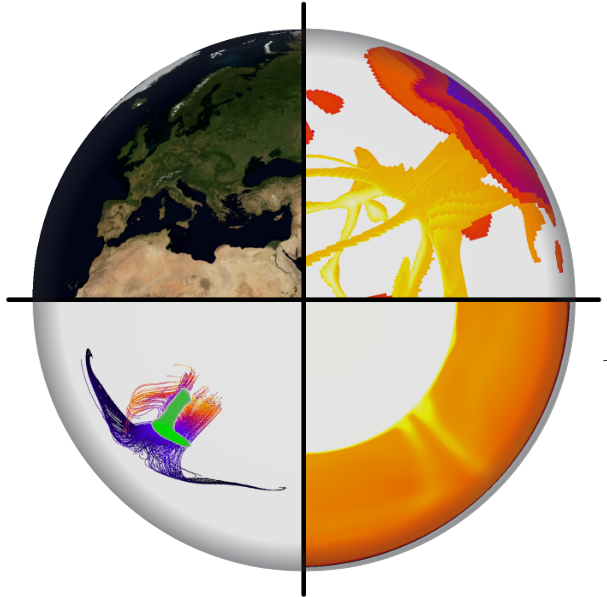 Visual Analysis of Spatio-temporal Features in Multi-field Earth’s Mantle Convection SimulationsMarina Evers, Simon Leistikow, Adrian Derstroff, and 5 more authorsIn SciVis Contest 2021, 2021
To build an understanding of the formation and constant change of the Earth, it is crucial to gain an understanding of the convection processes in the Earth’s mantle describing the distributions and paths of hot and cold material. We present an interactive visual analysis tool for the extraction and analysis of spatio-temporal features in multi-field Earth’ mantle convection simulations.
@inproceedings{scivisContest2021Entry,
  booktitle = {SciVis Contest 2021},
  title = {Visual Analysis of Spatio-temporal Features in Multi-field Earth's Mantle Convection Simulations},
  author = {Evers, Marina and Leistikow, Simon and Derstroff, Adrian and Gerrits, Tim and Huesmann, Karim and Hollenbeck, Jonathan and Seljami, Julian and Linsen, Lars},
  year = {2021},
  publisher = {IEEE},
}


2019
-
 A Visual Analytics Approach for Comparing Cohorts in Single-Voxel Magnetic Resonance Spectroscopy DataMuhammad Jawad, Marina Evers, Alexander Gerwing, and 6 more authors2019
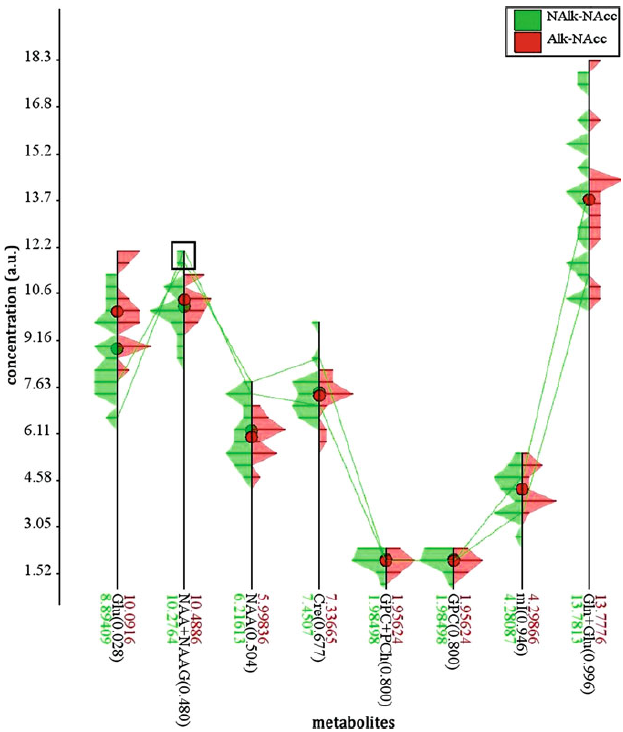
Single-voxel proton magnetic resonance spectroscopy (1H-MRS) is a non-invasive in-vivo technology to measure metabolic concentrations in selected regions of interest in a tissue, e.g., the brain. 1H-MRS generates spectra of signals with different frequencies and specific intensities which can be assigned to respective metabolites in the investigated tissue and quantified. In studies designed to detect biomarkers of a specific disorder or dysfunction, the overall goal is not just to analyze a single 1H-MRS data set, but to compare patient cohorts against healthy controls. We propose a visual analytics tool for the comparative analyses of cohorts, i.e., sets of data sets. Each data set can be regarded as a multivariate data sample, in which each variable represents the concentration of a metabolite. While a standard workflow for comparative analyses of two cohorts is routinely deployed by analyzing metabolites individually, our tool allows for comparative cohort analysis in a multivariate setting. Our top-down analysis strategy uses multidimensional data visualization methods combined with statistical plots and statistical analyses. We document and evaluate the effectiveness of our approach for the interactive analysis of metabolite concentrations in three brain regions for a comparative study of an alcohol-dependent patient cohort and a healthy control group.
@inbook{Jawad2019, author = {Jawad, Muhammad and Evers, Marina and Gerwing, Alexander and Herick, Maria and Seibert, Daniel and Bauer, Jochen and Kugel, Harald and Ohrmann, Patricia and Linsen, Lars}, editor = {Rea, Paul M.}, title = {A Visual Analytics Approach for Comparing Cohorts in Single-Voxel Magnetic Resonance Spectroscopy Data}, booktitle = {Biomedical Visualisation : Volume 2}, year = {2019}, publisher = {Springer International Publishing}, address = {Cham}, pages = {115--136}, isbn = {978-3-030-14227-8}, doi = {10.1007/978-3-030-14227-8_9}, } -
 Uncertainty-aware Prediction in Spatio-temporal Simulation Ensemble VisualizationsMarina Evers, and Lars LinsenIn Proceedings of the 14th International Joint Conference on Computer Vision, Imaging and Computer Graphics Theory and Applications (VISIGRAPP 2019) - IVAPP, 2019
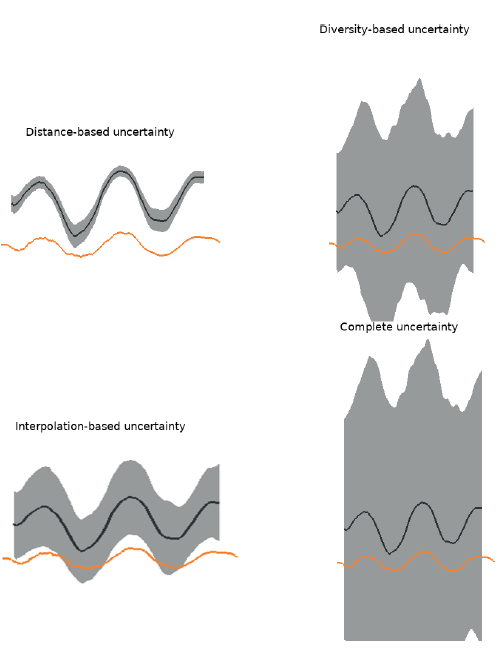
Spatio-temporal simulation ensembles are used to investigate the dependence of the simulation behavior on input parameters. Running simulations for a large number of input parameter settings is computationally expensive. We propose a scheme for exploring the parameter space using predictions of simulation outcomes and estimating the uncertainty in the predictions. The prediction approximates the simulation result by interpolating feature vectors of existing runs. The feature vectors are used to compute similarities between simulation runs facilitating visualization of the entire ensemble within a 2D (or 1D-over-time) multi-dimensional scaling embedding. Uncertainties of the prediction are computed based on distance, interpolation and diversity, which are visually encoded by an uncertainty band in the embedding. To guide the user to choose suitable parameter settings for prediction, we also propose a parameter-space visualization of the uncertainty. The approach is applied to real-wor ld data simulating deep-water impact of asteroids.
@inproceedings{evers2019uncertainty,
  title = {Uncertainty-aware Prediction in Spatio-temporal Simulation Ensemble Visualizations},
  author = {Evers, Marina and Linsen, Lars},
  booktitle = {Proceedings of the 14th International Joint Conference on Computer Vision, Imaging and Computer Graphics Theory and Applications (VISIGRAPP 2019) - IVAPP},
  pages = {216--224},
  year = {2019},
  isbn = {978-989-758-354-4},
  issn = {2184-4321},
  doi = {10.5220/0007344702160224}
}

